Control 01
Security and access
Least-privilege source access, workspace roles, RLS validation, and a clear separation between builders, consumers, and administrators.
Since 2012 · Independent Power BI consulting
We serve mid-size and large organizations that still close the week in Excel, disagree on KPI definitions, or cannot trust overnight refresh. Outcome: a governed semantic model, reports tied to owners and thresholds, and a handover your team can run — not a one-off dashboard file.
What we do
Four engagement types we actually run — with the data-source and gateway decisions buyers should expect to hear in discovery.
Star-schema semantic models, measure dictionaries, and workspace ownership. We decide Import vs DirectQuery per source: Import for stable executive packs; DirectQuery only when latency demands it and the source can absorb query load.
Replace fragile workbook consolidations with Power Query staging, keyed dimensions, and refresh that fails loudly. Common failure we fix: privacy-level misconfigs that disable query folding and blow out gateway refresh windows.
On-premises data gateway install path, concurrent refresh slots, credential rotation, and failure runbooks. Overnight packs should not depend on an analyst laptop staying awake.
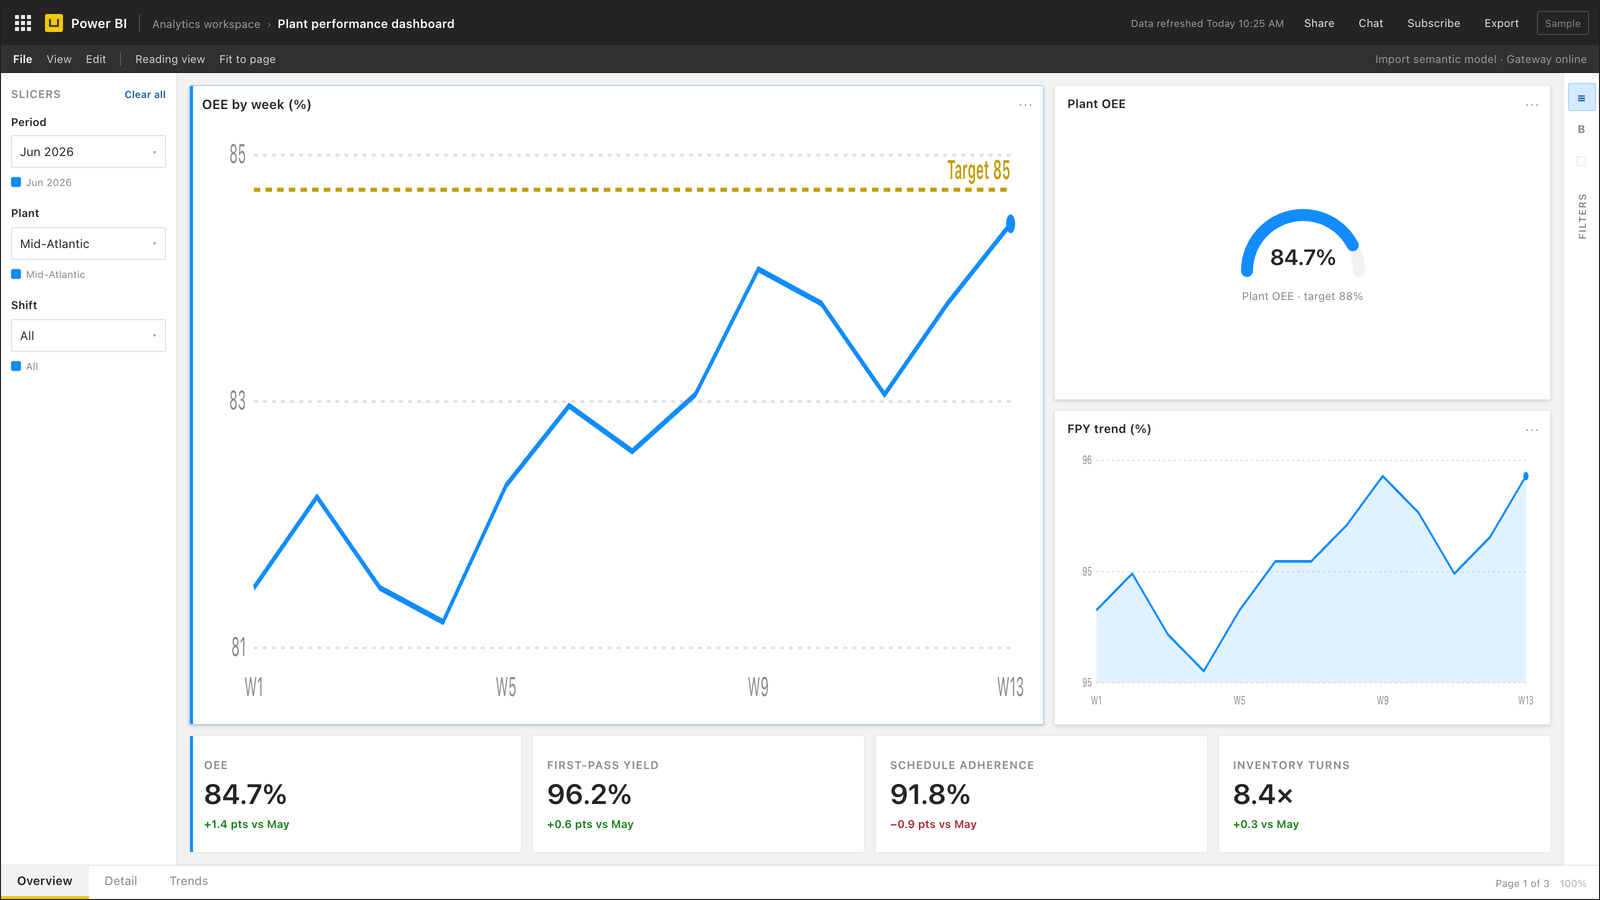
Pages designed around owners, thresholds, and drill-through — P&L/cash, plant OEE, capacity huddles, trading packs. Visual polish without a maintainable model is out of scope.
From source to decision
The dashboard is the visible end of the work. The operating value comes from controlled preparation, governed definitions, and a refresh path that survives production.
ERP, CRM, MES, finance workbooks, SQL databases, APIs, and operational extracts—with ownership and refresh expectations recorded before build.
SAP · Dynamics 365 · NetSuite · Salesforce · SQL · Excel
Gateway paths, Power Query staging, typed keys, reconciliation checks, and query-folding review before transformations reach the model.
Gateway · Power Query · Dataflows · quality checks
Star schema, conformed dimensions, explicit DAX measures, row-level security, and one documented definition for each decision KPI.
Import / DirectQuery · DAX · RLS · measure dictionary
Executive and operating pages organized around thresholds, owners, exceptions, and drill-through—not a wall of disconnected charts.
Scorecards · exception queues · drill-through · mobile
Reconciled totals before release
Named owners for KPI definitions
Refresh failures routed—not discovered in meetings
Proof
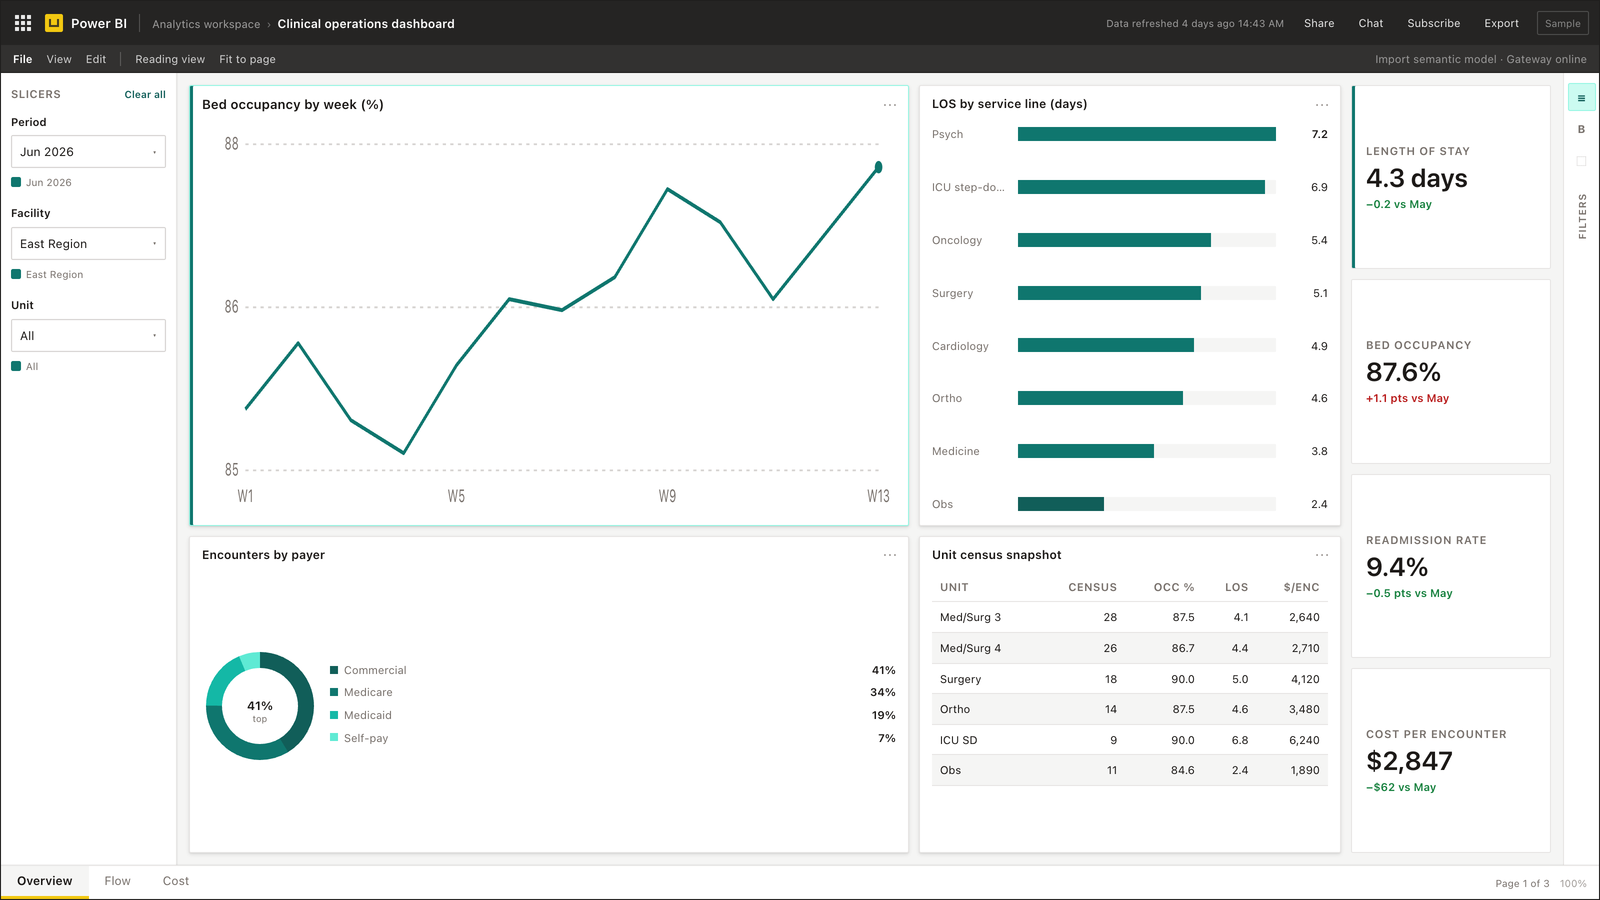
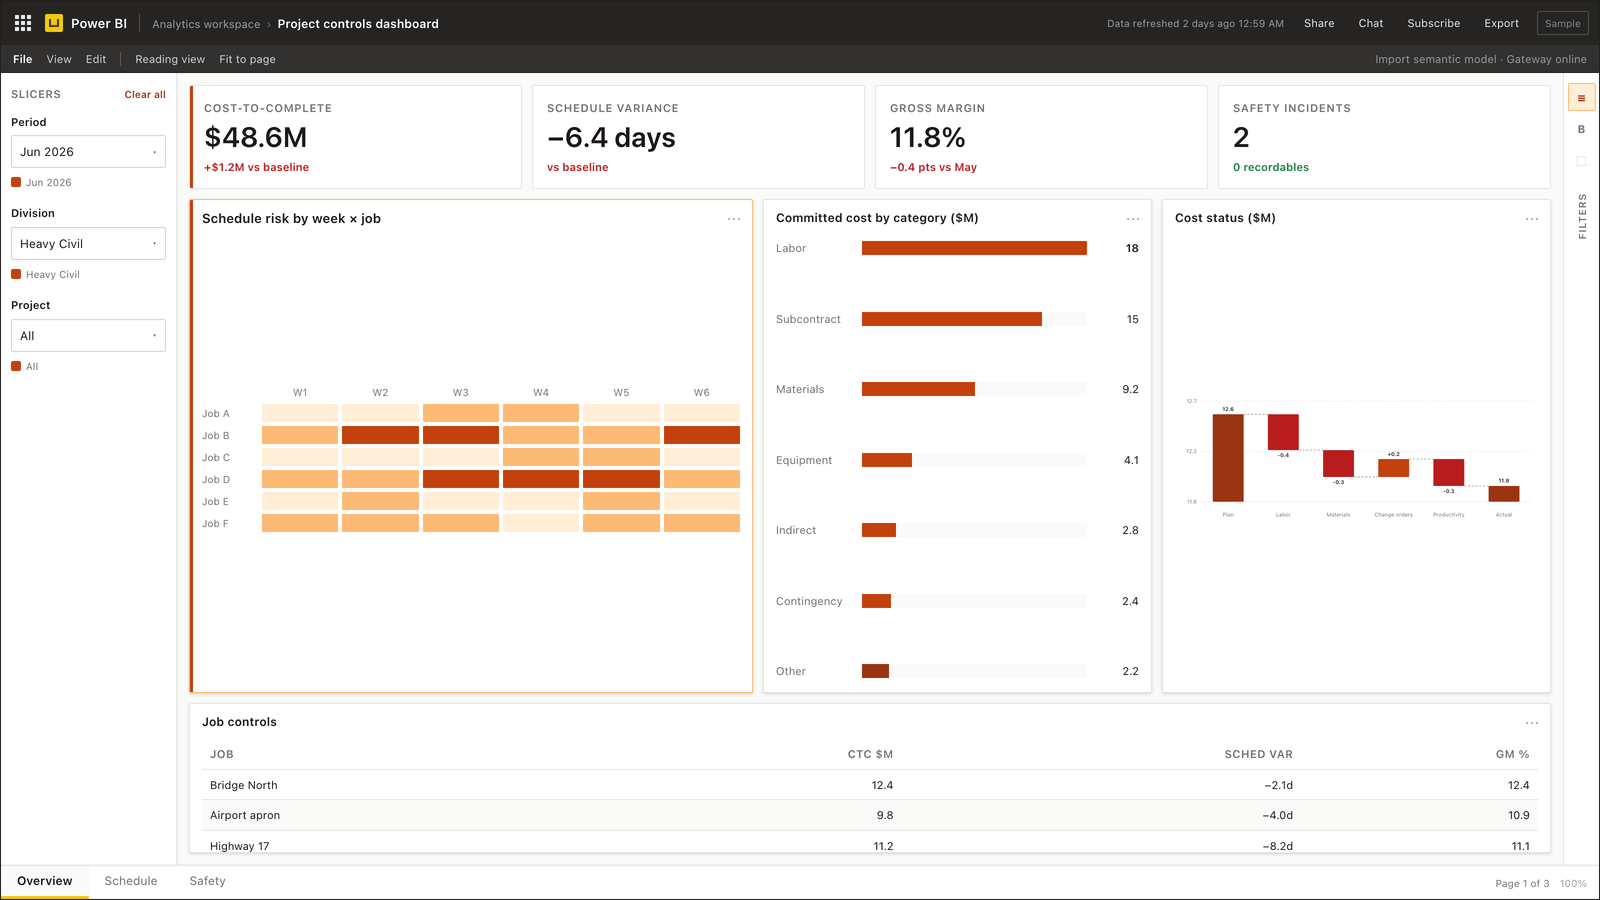
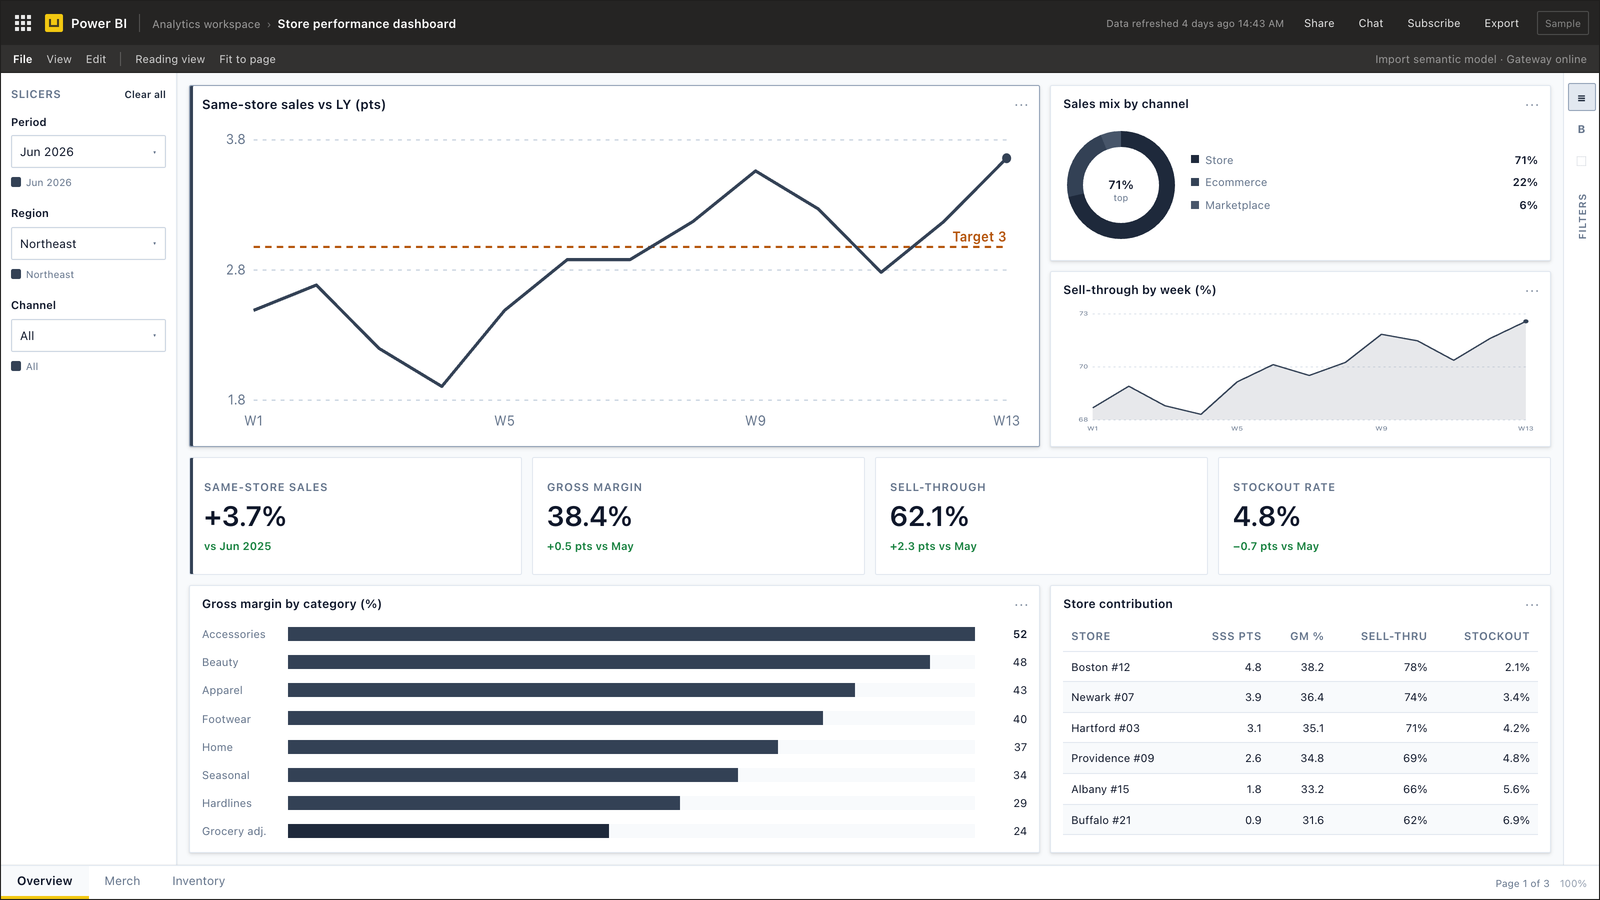
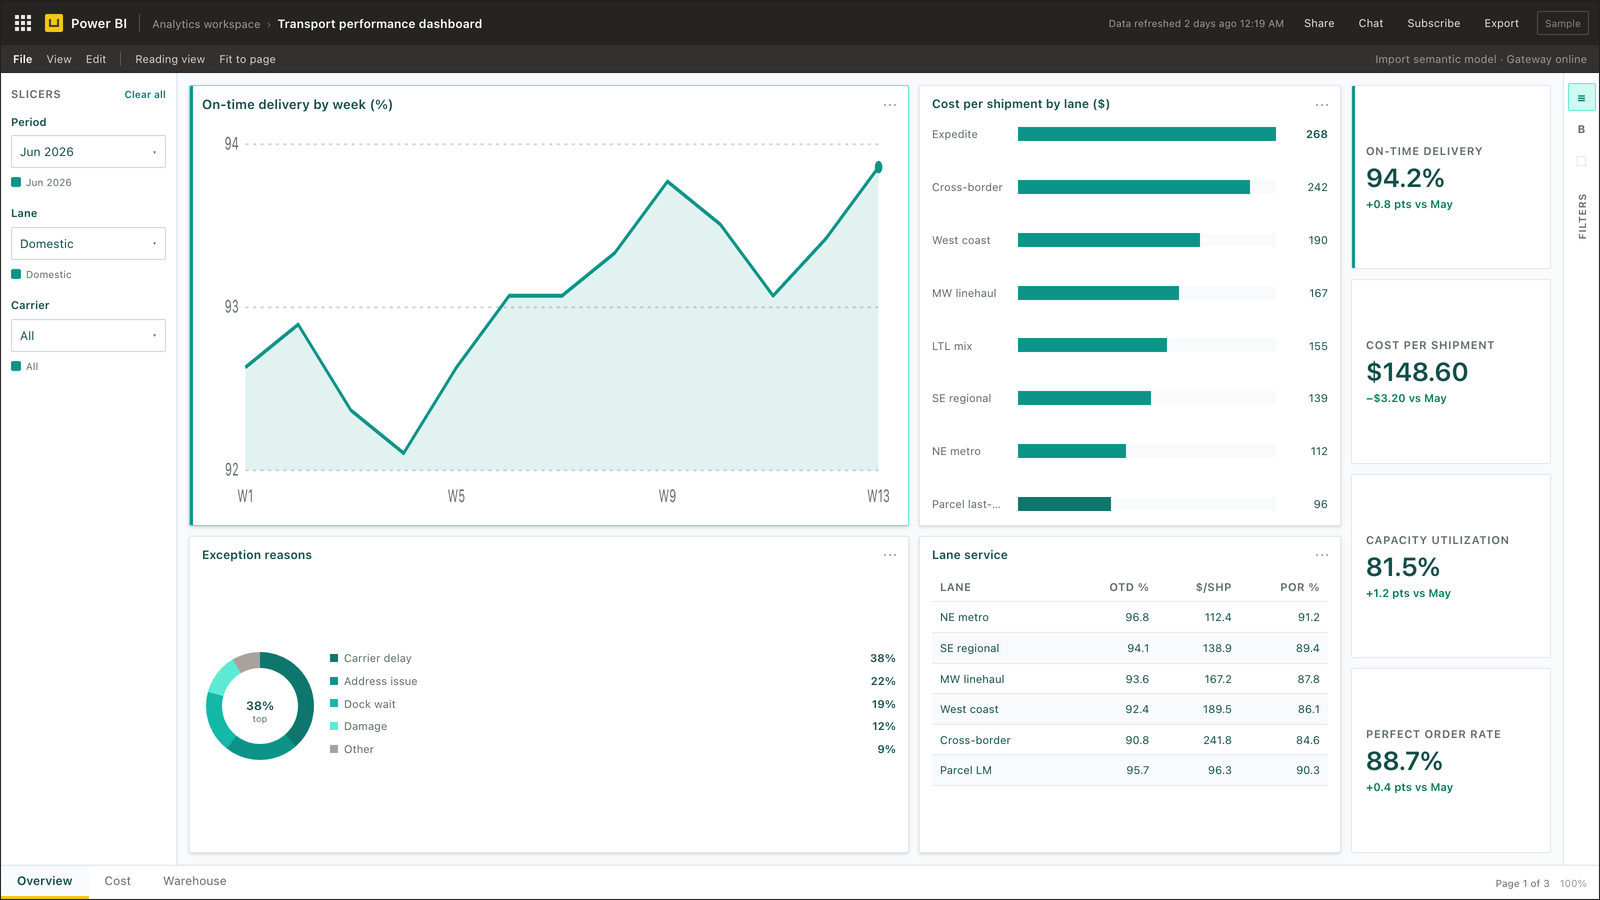
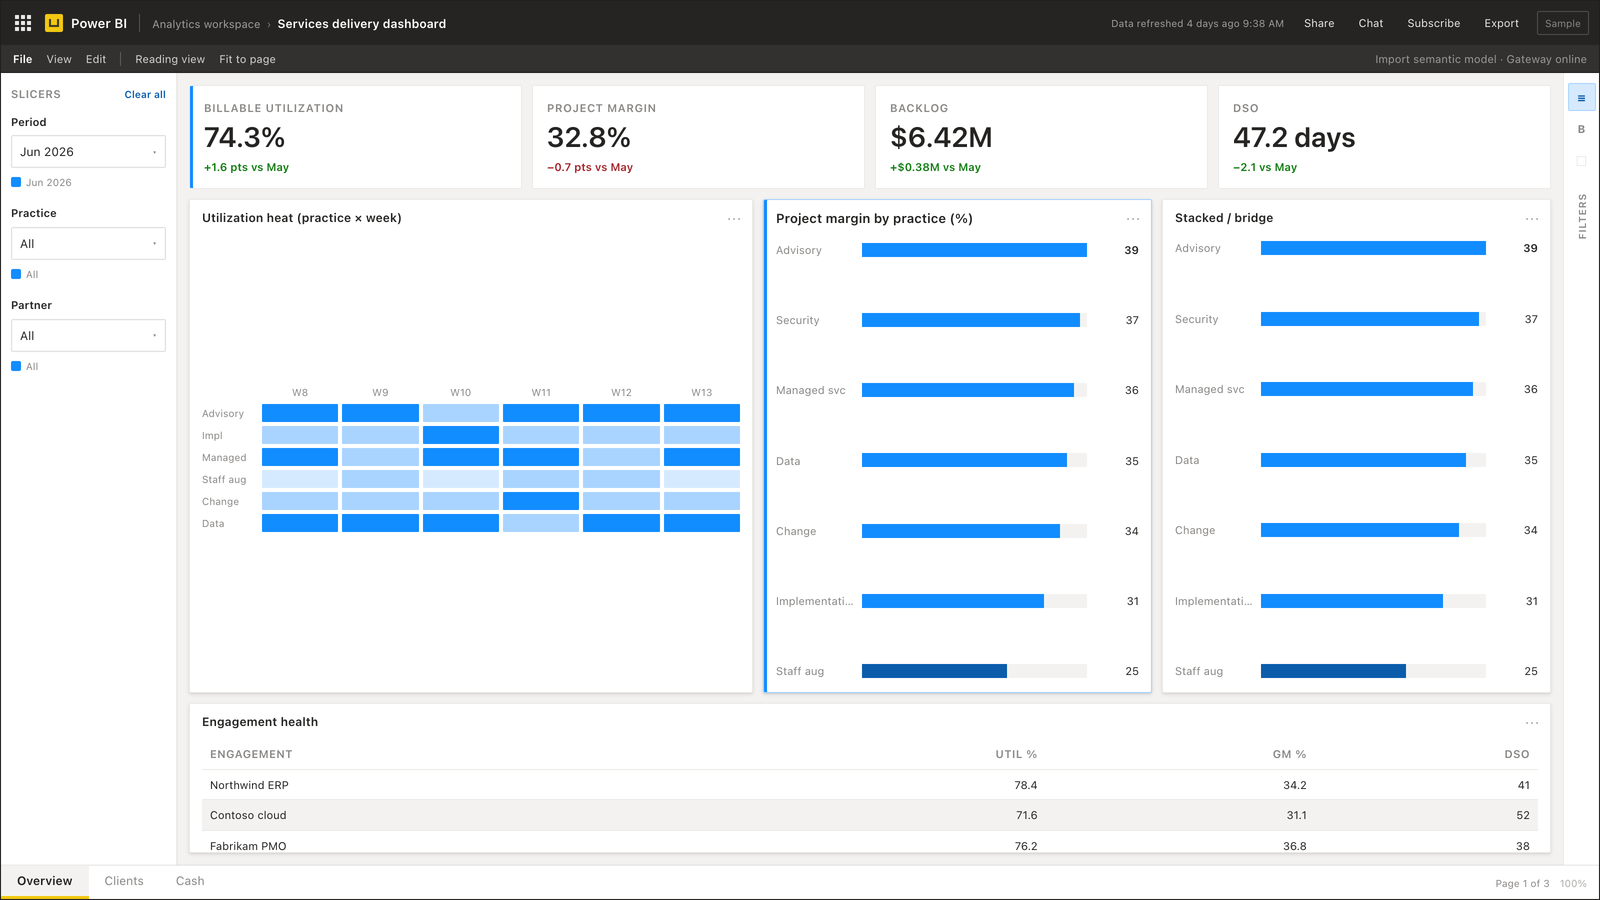
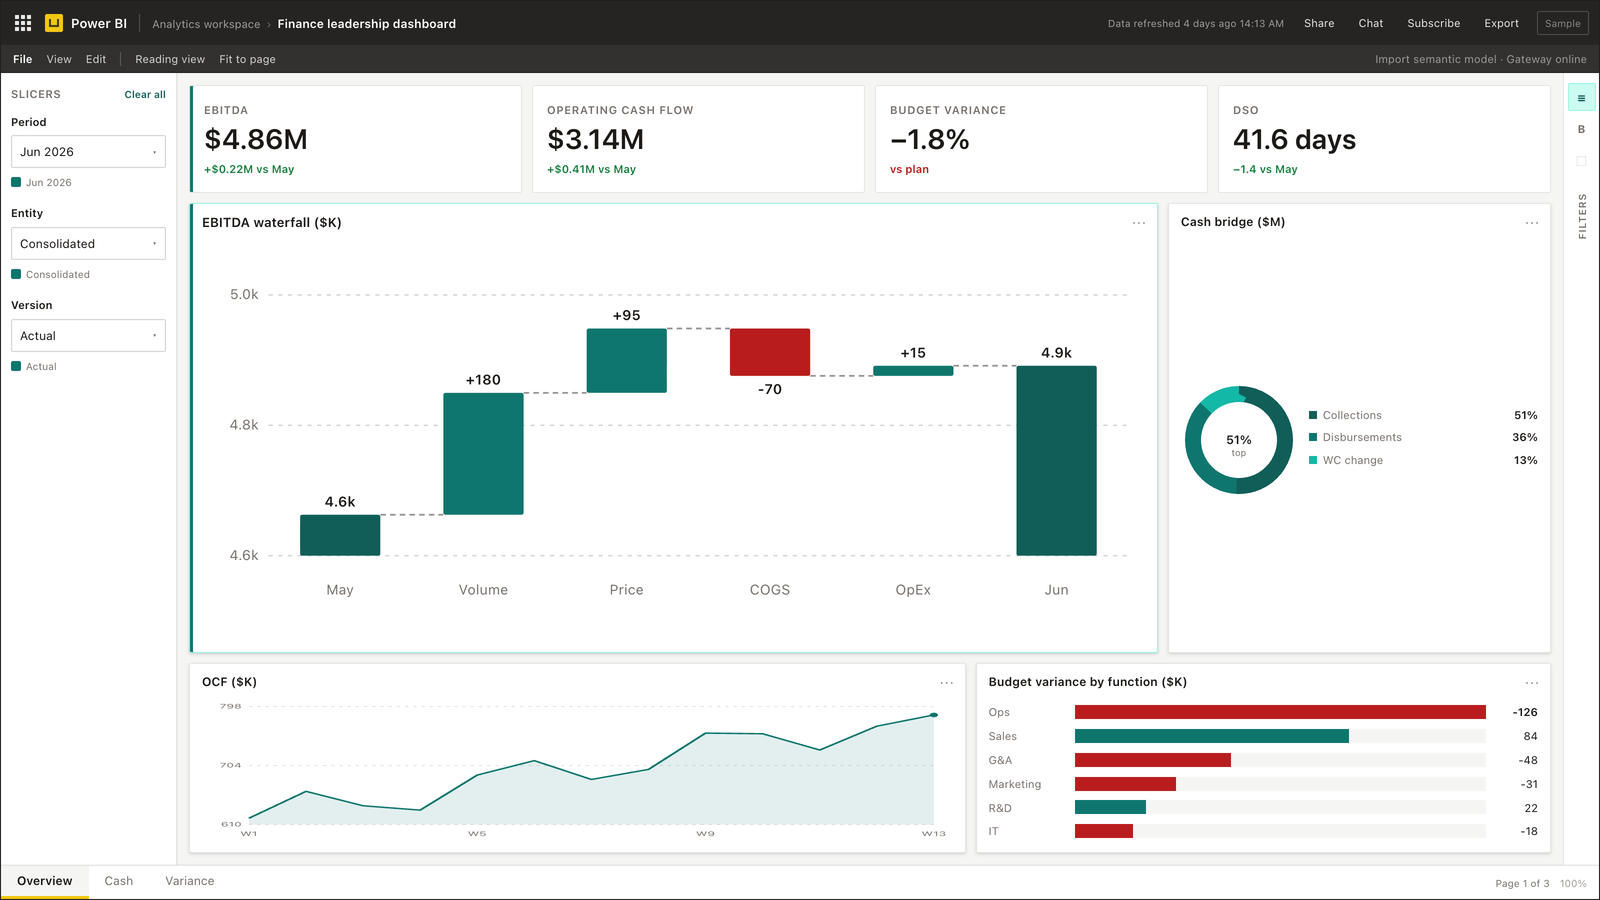
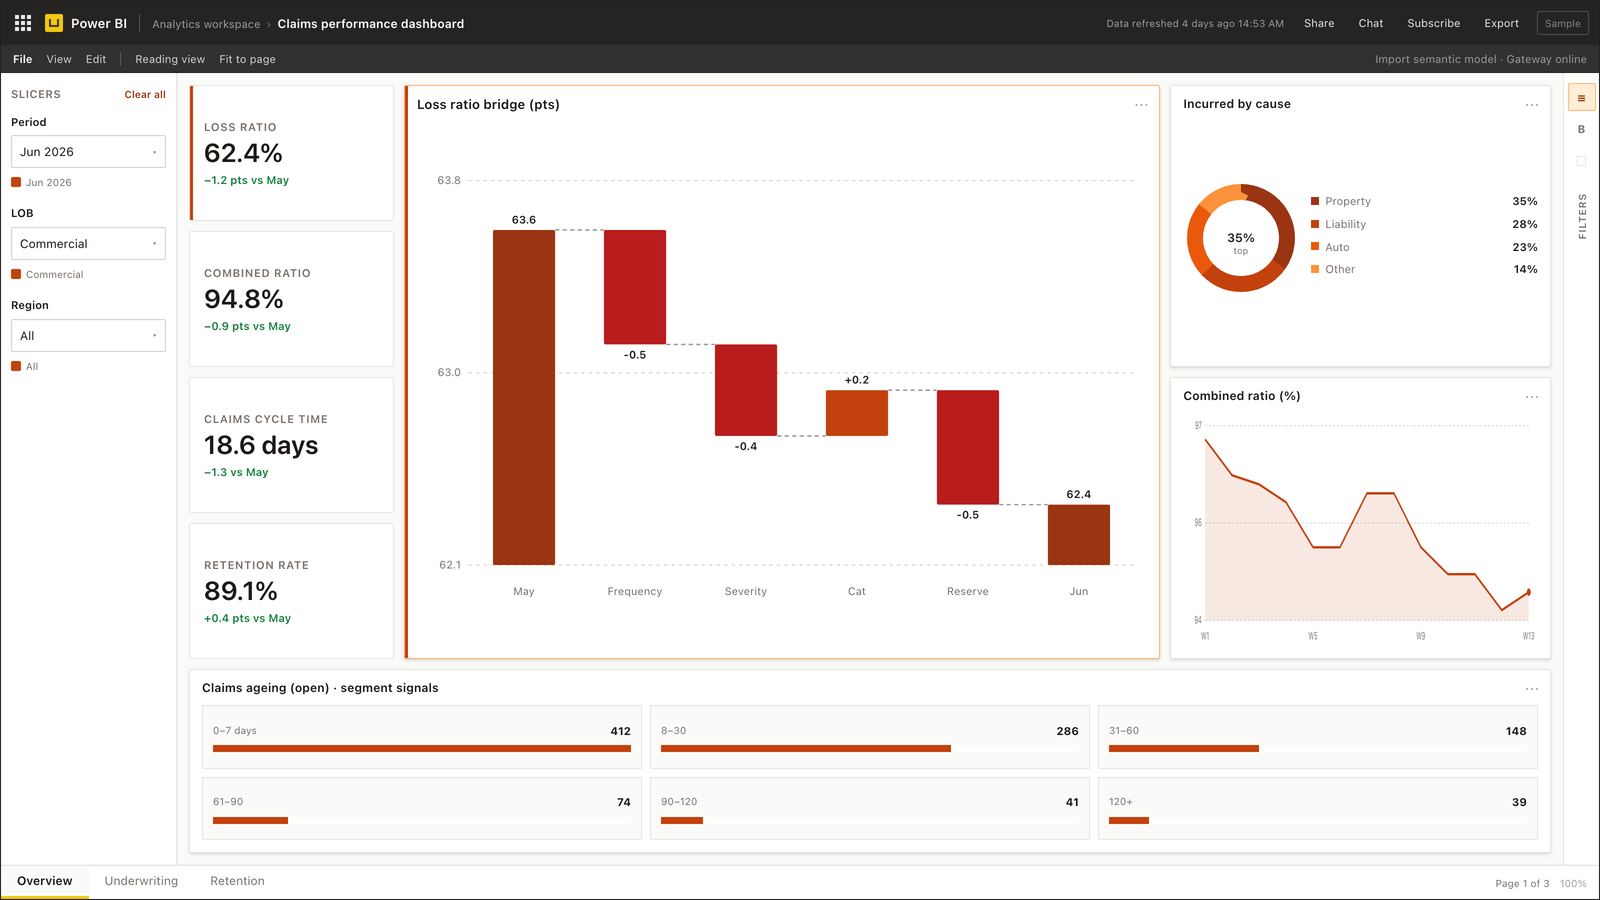
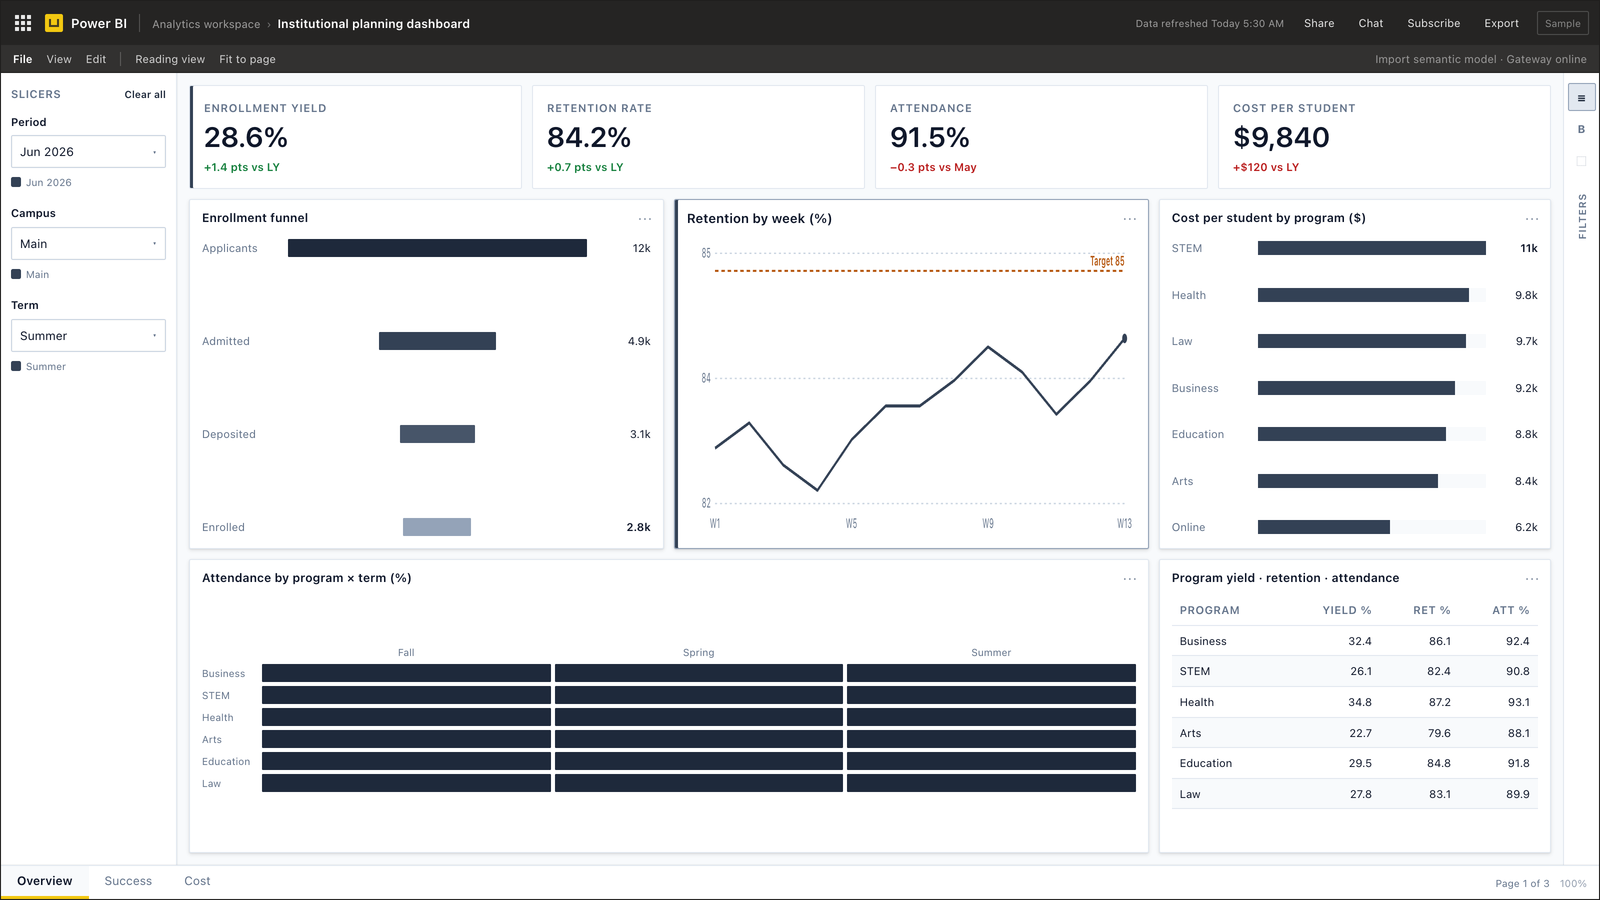
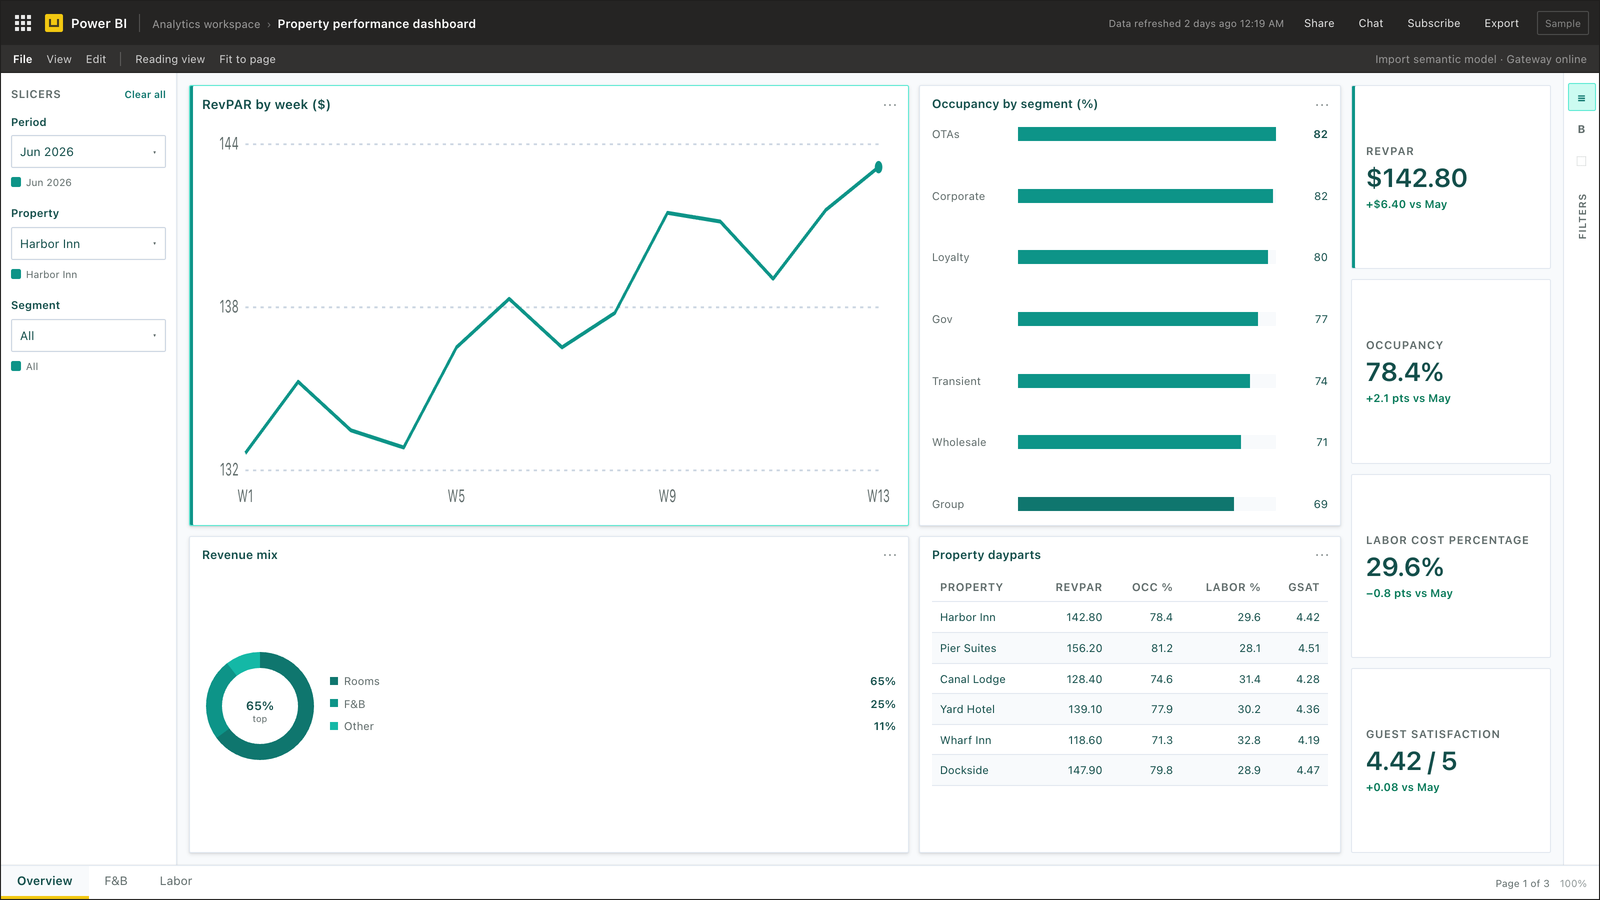
Example Power BI views we build for executives, operations, and finance — illustrative decision layouts, not client screenshots.
Read anonymised engagement write-ups on case studies.
Production readiness
A polished PBIX is not a production operating model. Security, refresh, performance, and ownership are designed alongside the report.
Control 01
Least-privilege source access, workspace roles, RLS validation, and a clear separation between builders, consumers, and administrators.
Control 02
Gateway ownership, credential rotation, refresh-window design, failure routing, and runbooks for the morning when an upstream extract arrives late.
Control 03
Import by default for predictable executive reporting; DirectQuery only when latency justifies the source load. Model size, folding, and visual query cost are reviewed together.
Control 04
Measure definitions, lineage notes, deployment steps, refresh support, and an enhancement backlog that business and IT can operate after release.
Why this delivery model
The engagement is structured for risk-aware buyers who need a useful first release and a maintainable path after it.
Finance and executive teams
One governed view of margin, cash, forecast, and variance—with commentary tied to owners rather than another reconciliation meeting.
Operations leaders
Earlier exceptions across plants, service teams, inventory, quality, or delivery so the review starts with action instead of spreadsheet preparation.
IT and analytics owners
A supportable model, explicit access paths, controlled deployment, and documentation that does not leave production knowledge with one consultant.
How engagement works
Typical first-release rhythm when stakeholders and sample data are available. IT change control, DirectQuery against busy ERPs, or multi-entity COA cleanup extends the calendar — we write that into the proposal.
Step 1 · 3–5 working days
Decision owners, source systems, KPI definitions, and access path. Fixed-scope proposal with assumptions written down — not a vague SOW.
Step 2 · 2–6 weeks typical first release
Staging queries, semantic model, RLS where needed, gateway/refresh design (Import vs DirectQuery chosen per latency and source load), and validated reports.
Step 3 · 3–5 working days
Measure documentation, refresh runbook, workspace ownership, and a short enhancement backlog. Support after go-live is scoped separately.
One-page summary of services and stack: capability PDF.
Industries
ERP, MES, clinical ops, retail POS, and TMS feeds do not share the same grain or cut-off rules. Start from your industry page.
Pricing model, timeline, security/NDA, ERP connectivity, and post-delivery support.
05
Buyer questions answered
Talk through priorities, data sources, and a practical first Power BI release.